Office 365 Licenses
- Chandler Berry
The Licenses features multiple statistics on the License status in the Office 365 environment.
About the Licenses tab
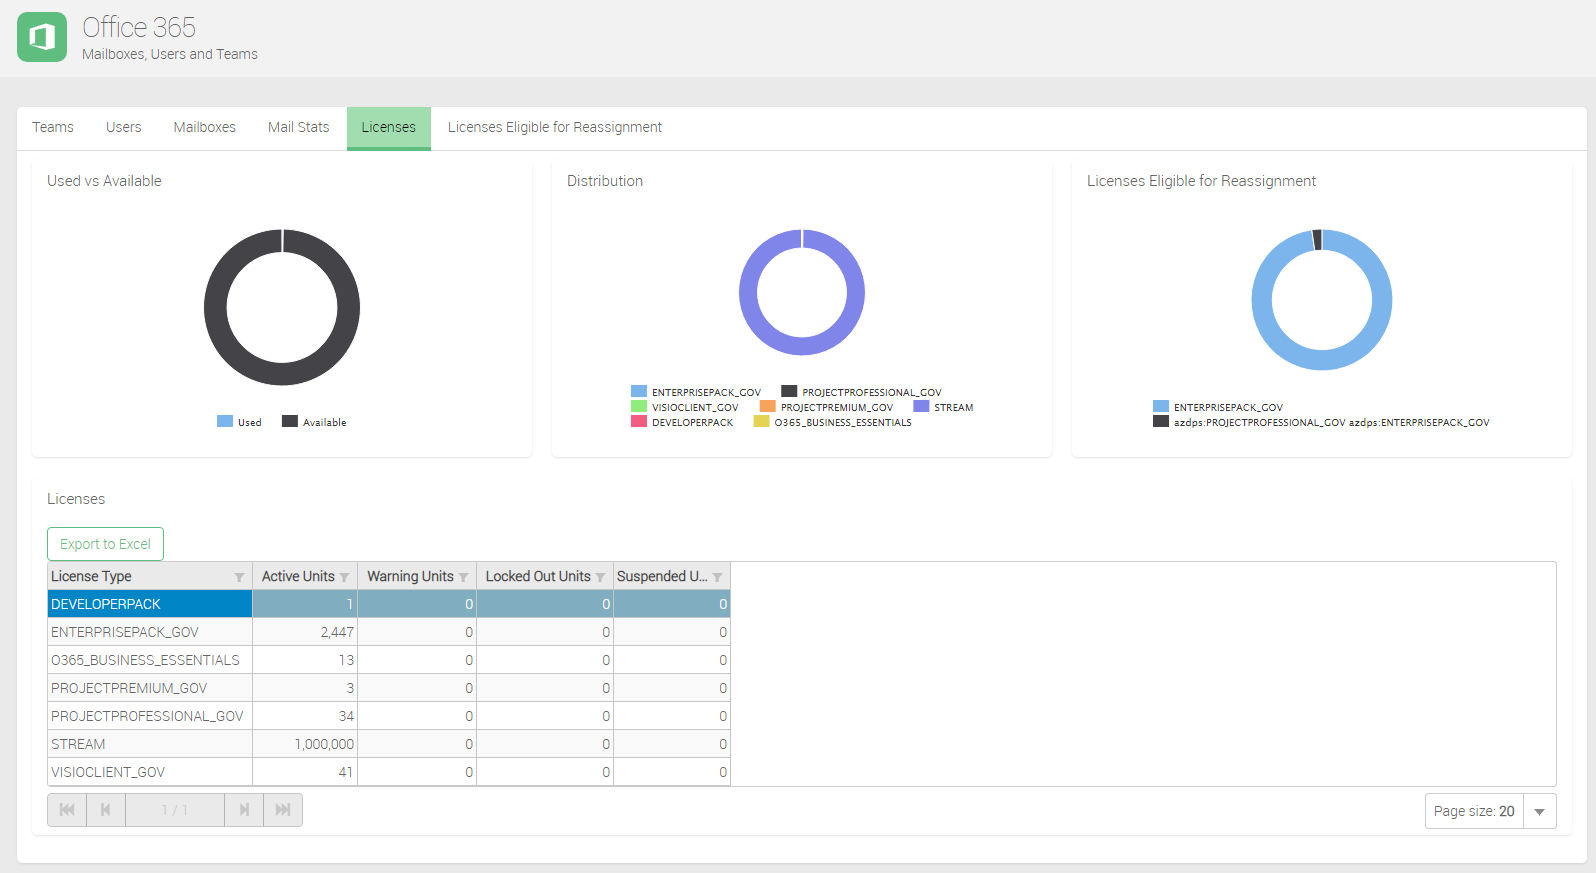
The Licenses tab features 3 pie-type charts, and a table that describe the usage of licenses in the Office 365 environment.
The page features 3 pie-type charts that detail the following things:
- Used vs. Available
- Distribution
- Licenses Eligible for Reassignment
Used vs. Available shows the ratio of Used and Available licenses. Distribution shows the ratio between all of the License types being utilized. Licenses Eligible for Reassignment shows the ratio of license types tat are available for reassignment.
The table has the following columns:
- License Type
- Active Units
- Warning Units
- Locked Out Units
- Suspended Units
License Type is the type of the license. Active Units shows the amount of licenses of that type are active. Warning Unit shows the amount of licenses are in a Warning state for that type. Locked Out Units displays the amount of licenses are in a Locked Out state for that type. Suspended Units shows the amount of licenses are in a Suspended state for that type.
All Key Metrics can be exported to Excel with the "Export to Excel" button located at the top of every Key Metric page.