/
Dashboard
Dashboard
- Chandler Berry
Owned by Chandler Berry
Last updated: Sept 06, 2018
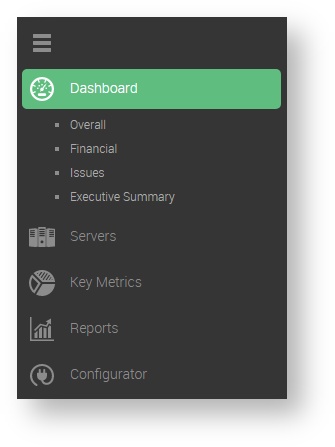
The Dashboard Bar includes 3 sub-pages that give the user Vital insight into the health of the configured servers and databases.
About the Dashboard Bar
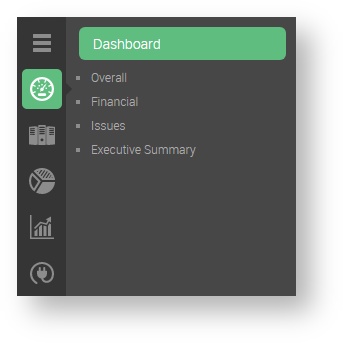
The Dashboard Bar is the 1st in 5 separate categories in the Side Bar Navigation Pane. The pages that can be accessed from this category are the following:
Overall: This page shows the status of all configured servers, as well as several availability-related widgets.
When the user clicks on the Dashboard button, VitalSigns will navigate to the Overall page by default.
Financial: This page shows several informative graphs relating to the costs of all configured servers.
Issues: This page gives a list of all current issues reported by VitalSigns, and gives information on all issues.
Executive Summary: This page gives the ability to check the environment's servers at-a-glance.
, multiple selections available,
Related content
Side Bar Navigation
Side Bar Navigation
More like this
Servers & Configuration Reports
Servers & Configuration Reports
More like this
Reports
More like this
Servers
More like this
Issues
More like this
Introduction
Introduction
More like this