Key Metrics
- Chandler Berry
The Key Metrics Bar includes 10 sub-pages that give incredible insight into the inner workings of the monitored servers, and their use by users.
About the Key Metrics Bar
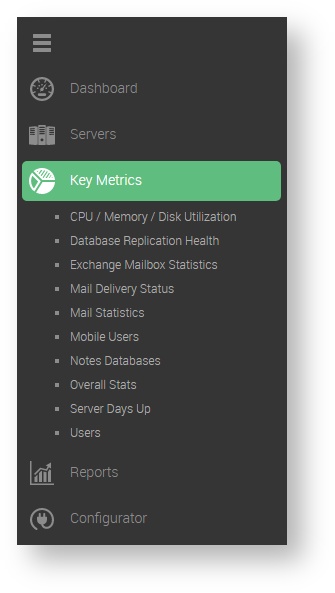
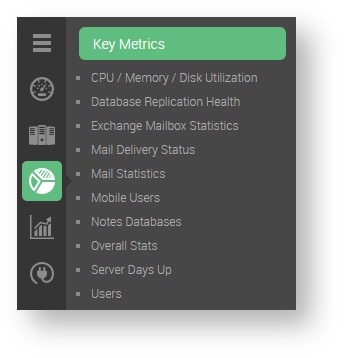
The Key Metrics Bar is the 3rd in 5 separate categories in the Side Bar Navigation Pane. The pages that can be accessed from this category are the following:
- CPU / Memory / Disk Utilization Key Metric
- Database Replication Health Key Metric
- Mail Delivery Status
- Mail Statistics
- Mobile Users
- Notes Database Metrics
- Overall Statistics
- Server Days Up
- User Metrics
CPU / Memory / Disk Utilization: This page shows the hardware performance of all servers, showing their response time, CPU utilization, Disk, and RAM usage.
Database Replication Health: This page shows a brief glimpse into the internals of connected databases, and highlights if there is any replication issues.
Exchange Mailbox and Users: This page has multiple tabs that list out every mailbox and user in Exchange.
Office 365: This page has multiple tabs that describe a multitude of information on Teams, Users, and Mailboxes, and Licenses Management.
Mail Delivery Status: This page shows the status of all mail servers being monitored, and shows the amount of pending, held, and dead mail for each
Mail Statistics: This page shows all the configured users for the mail servers being monitored, and shows each user's usage stats and much more.
When the user clicks on the Key Metrics button, VitalSigns will navigate to the Mail Statistics page by default.
Mobile Users: This page gives a list of all mobile users and devices that are being synced with the monitored servers.
Notes Databases: This page gives a list of all nsf files inside of the IBM Notes databases.
Overall Stats: This page will give every stat for all IBM Domino servers being monitored within a certain time frame.
Server Days Up: This page shows how long the IBM Domino servers that are being monitored have been up.
Users: This page shows how many users connect to each of the monitored servers.