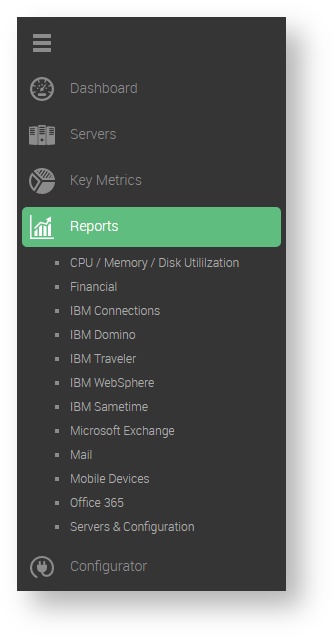
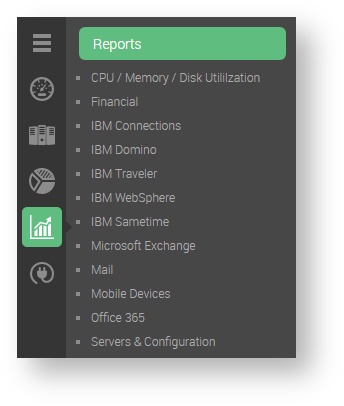
About the Reports Bar
The Reports Bar is the 4th in 5 separate categories in the Side Bar Navigation Pane. The pages that can be accessed from this category are the following:
CPU / Memory / Disk Utilization: This page includes 5 separate reports that cover CPU utilization, RAM usage, and Disk Usage.
Financial: This page includes 3 separate reports on various costs incurred by the servers being monitored.
IBM Connections: This page includes 14 separate reports on the various track-able activities inside the monitored IBM Connections environments.
IBM Domino: This page includes 10 separate reports on the health and status of the monitored IBM Domino severs.
IBM Traveler: This page contains 7 separate reports relating to the usability of the Traveler service, and how users are using it.
IBM WebSphere: This page includes 3 separate reports relating to the status and performance of the WebSphere servers.
IBM Sametime: This page contains 2 reports on the usage of the monitored IBM Sametime servers.
Microsoft Exchange: This page contains 12 reports pertaining to Microsoft Exchange, such as Up Time and Memory Percentage
Mail: This page includes 2 reports on the usage of the Mail servers.
Mobile Devices: This page includes 3 separate reports on the users and their connected devices.
Office 365: This page includes 11 separate reports on the usability of the O365 system.
Servers & Configuration: This page has 9 separate reports on the various performance statistics of all connected servers.

