WebSphere Threshold Settings
- Chandler Berry
The IBM WebSphere Threshold Settings Report contains a list of all thresholds for each WebSphere instance.
About the IBM WebSphere Threshold Settings Report
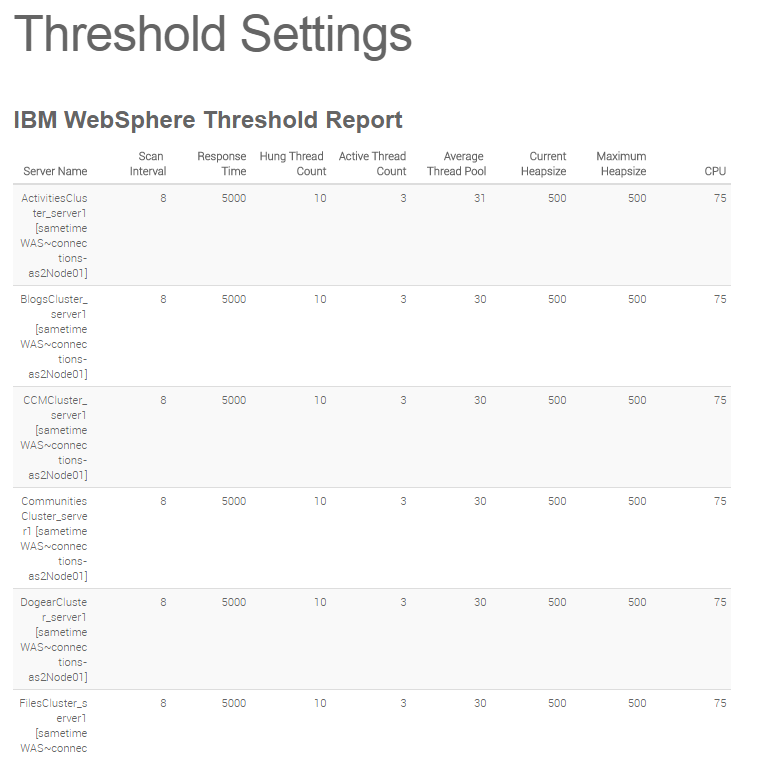
The IBM WebSphere Threshold Settings Report is home to a table that lists out every configured threshold for every currently configured WebSphere instance within the VitalSigns environment. When a WebSphere instance surpasses one of these thresholds, the instance will go into a "Issue" state.
The table has the following columns:
- Server Name
- Scan Interval
- Response Time
- Hung Thread Count
- Active Thread Count
- Average Thread Pool
- Current Heapsize
- Maximum Heapsize
- CPU
Server Name lists the name of the WebSphere instance.Scan Interval shows how often the thresholds are checked, in minutes. Response Time displays the threshold for the instance's response time. Hung Thread Count contains the threshold for the amount of Hung Threads. Active Thread Count shows the threshold for the amount of Active Threads. Average Thread Pool displays the threshold for the Average Thread Pool. Current Heapsize displays the threshold for the current size of the Heap. Maximum Heapsize lists the threshold for the Maximum size of the Heap. CPU shows the threshold for the percentage of CPU usage.
All Reports can be printed with the "Print Report" button located at the top of every report page.