Exchange CPU Utilization Report
- Chandler Berry
The Exchange CPU Utilization Report describes the percentage of CPU usage by Exchange.
About the Exchange CPU Utilization Report
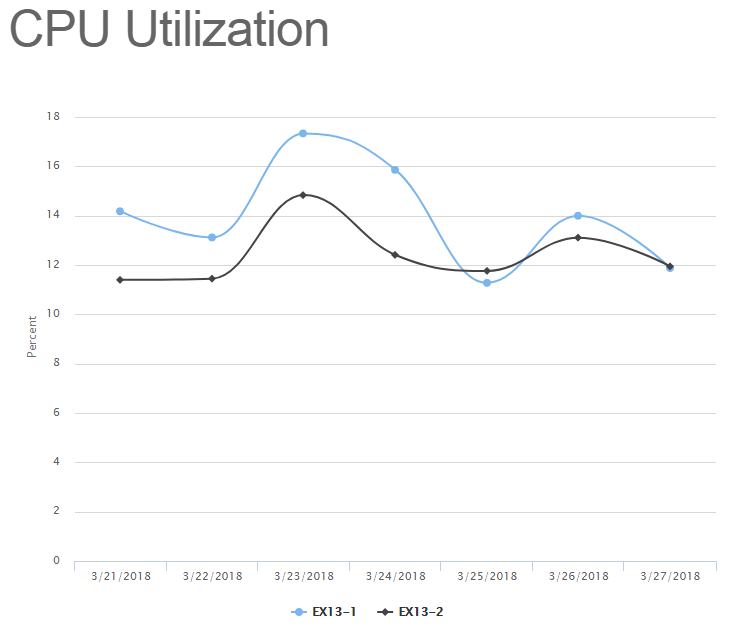
The Exchange CPU Utilization Report features a multiple-lin line-chart type graph that shows the daily average value of the CPU Utilization of every Exchange Server that is currently configured inside of the VitalSigns environment.
The report itself can be modified by several different filters:
- Start Date
- End Date
- Servers
Start Date denoted the date that the report will start from. Likewise, End Date denotes the date that the report will end at. Servers selects which server(s) (if multiple) will be included in the report.
Once the filters are applied, the line chart can be drilled down even further by clicking on the individual instances in the legend at the bottom. This will hide/show those servers from the line chart.
All Reports can be printed with the "Print Report" button located at the top of every report page.