Bookmarks Report
- Chandler Berry
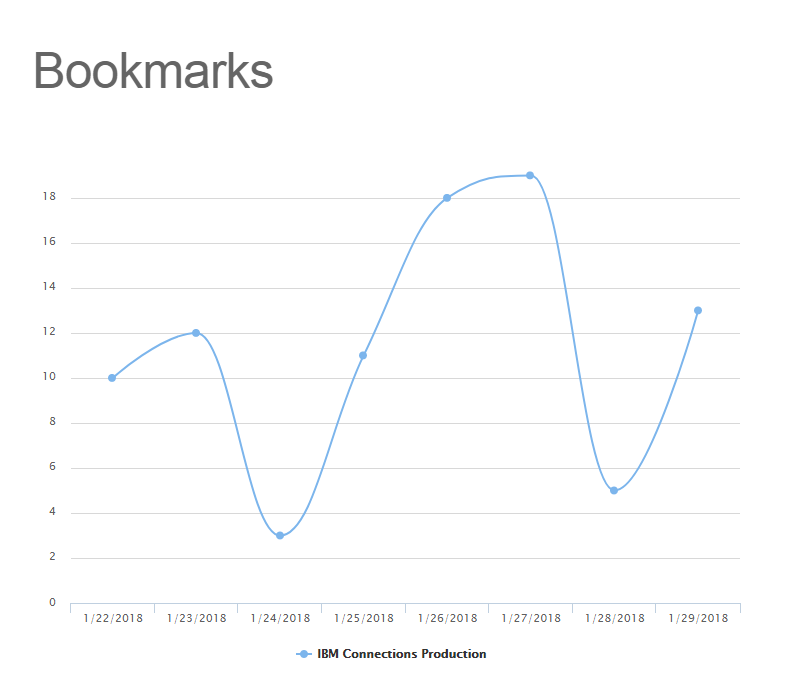
The IBM Connections Bookmarks Report utilizes a line chart type graph to show the change over time of Bookmarks in the VitalSigns environment.
About the IBM Connections Bookmarks Report
The IBM Connections Bookmarks Report displays a line chart type graph that models the status of Bookmarks within the monitored IBM Connections instances within the VitalSigns environment.
The report itself can be modified by several different filters:
- Start Date
- End Date
- Servers
- Select Stat
Start Date denoted the date that the report will start from. Likewise, End Date denotes the date that the report will end at. Servers selects which servers (if multiple) will be included in the report. Select stat will select which stat to display in the report: Bookmarks, Bookmarks Created Yesterday
Once the filters are applied, the line chart can be drilled down even further by clicking on the individual Servers in the legend at the bottom. This will hide/show those Servers from the line chart.
All Reports can be printed with the "Print Report" button located at the top of every report page.