Internal Champions Monthly Report
- Chandler Berry
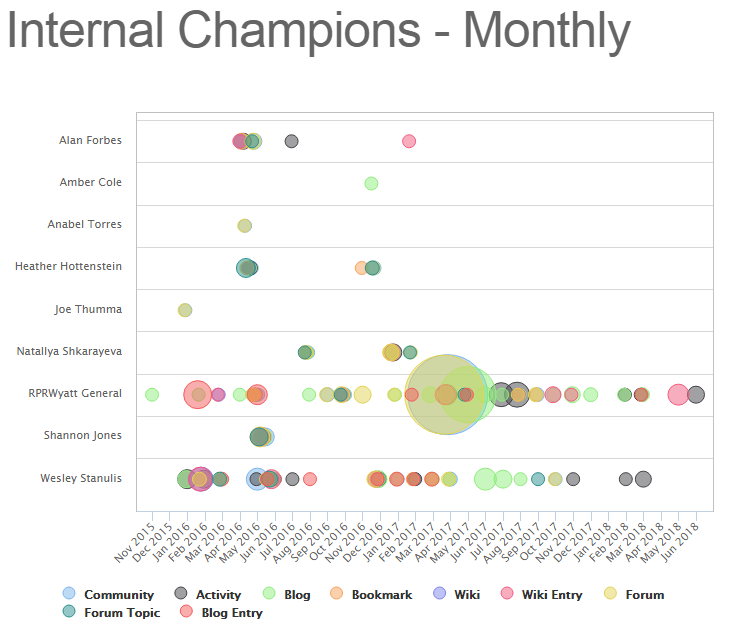
The IBM Connections Internal Champions Monthly Report utilizes a heat-map type graph to show how Users interact with the various IBM Connections features.
About the IBM Connections Internal Champions Monthly Report
The IBM Connections Internal Champions Monthly Report is a heat-map type chart that utilizes scaled circles to show what Users utilize what IBM Connections feature, and when they utilize them.
The report itself can be modified by a filter:
- Servers
- Communities
- Users
- Top X Users
Servers selects which servers (if multiple) will be included in the report. Communities selects which communities will be included in the report. Users selects which users to be included in the report. Top X Users limits the scope of the report to predetermined increments between 1 and 100.
The X-axis spans time (Specifically in a "Month Year" format) non consecutively. For instance, if no users use any tool in a month(s) the report will skip the empty month(s).
The Y-axis lists all Users that have used a Connections feature at least once.
The legend at the bottom of the report shows each Feature that is being tracked in the heat-map.
Once the filters are applied, the heat-map can be drilled down even further by clicking on the individual IBM Connections features in the legend at the bottom. This will hide/show those features from the heat-map.
All Reports can be printed with the "Print Report" button located at the top of every report page.