/
Cluster Seconds on Queue Report
Cluster Seconds on Queue Report
- Chandler Berry
Owned by Chandler Berry
Last updated: Feb 13, 2018
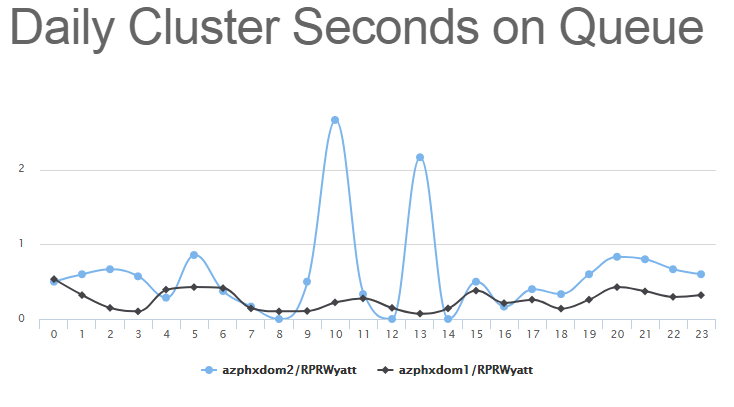
The IBM Domino Cluster Seconds on Queue Report displays the hourly amount of time the Cluster is on Queue.
About the IBM Domino Cluster Seconds on Queue Report
The IBM Domino Cluster Seconds on Queue Report features a line-chart that goes over each hour in a 24 hour time period in the X-axis, and displays the amount of time on the Queue in seconds in the Y-axis.
The report itself can be modified by several different filters:
- Date
- Servers
The Date field selects which day the Report will focus on. The Servers field selects which IBM Domino servers within the VitalSigns environment should be displayed in the Report.
Once the filters are applied, the line chart can be drilled down even further by clicking on the individual Servers in the legend at the bottom. This will hide/show those Servers from the line chart.
All Reports can be printed with the "Print Report" button located at the top of every report page.
, multiple selections available,
Related content
Response Times Report
Response Times Report
More like this
WebSphere Response Times Report
WebSphere Response Times Report
More like this
Server Utilization Report
Server Utilization Report
More like this
Sametime Monitoring (optional)
Sametime Monitoring (optional)
More like this
Cost per User Served Chart Report
Cost per User Served Chart Report
More like this
IBM SameTime Health
IBM SameTime Health
More like this