Overall
Overall
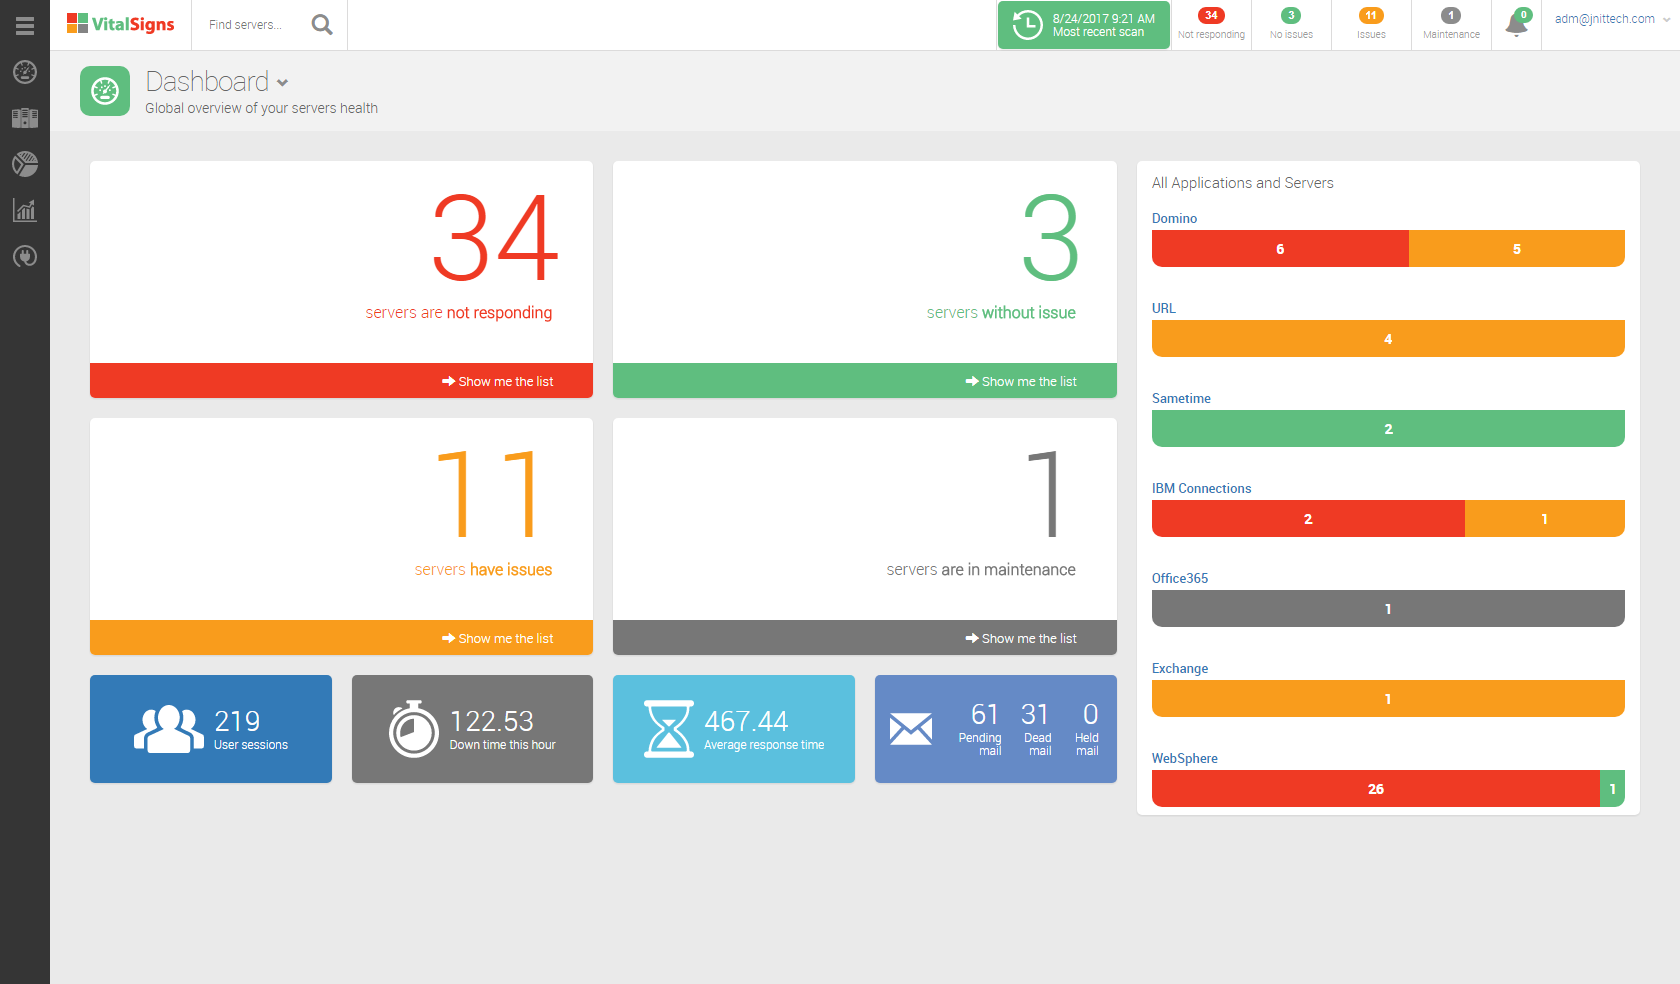
The Dashboard is where the information/data about your environment is displayed and can be useful to everybody in the organization. From the HelpDesk team, managers, and to power users they can all be kept up-to-date with the latest status and information in their IT environment from the VitalSigns Dashboard.
, multiple selections available,
Related content
Executive Summary
Executive Summary
More like this
Financial
More like this
Reports
More like this
Servers
More like this
Introduction
Introduction
More like this
CPU / Memory / Disk Utilization Reports
CPU / Memory / Disk Utilization Reports
More like this
