Sametime Statistics Chart Report
- Chandler Berry
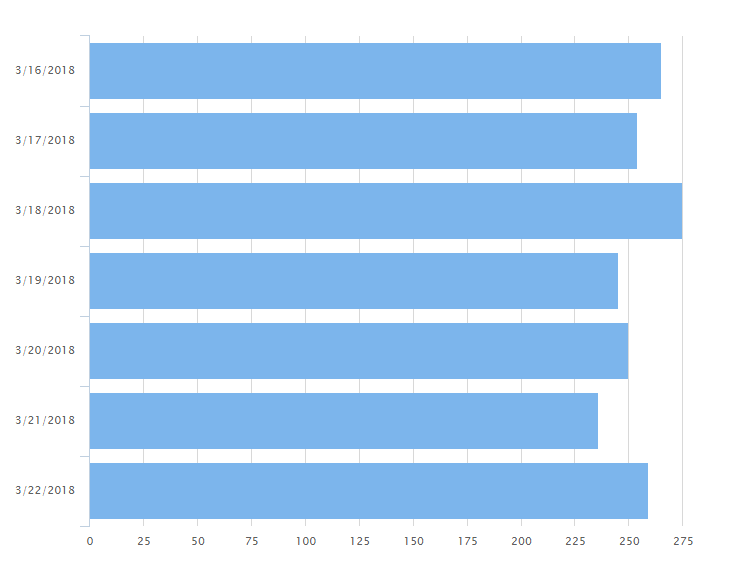
The Sametime Statistics Chart Report describes the amount of use that Sametime receives in the environment.
About the Sametime Statistics Chart Report
The Sametime Statistics Chart Report features a bar-chart type graph that shows the amount of times that Sametime has been used over a specified amount of time.
The report itself can be modified by several different filters:
- Start Date
- End Date
- Statistic
- Servers
Start Date denoted the date that the report will start from. Likewise, End Date denotes the date that the report will end at. Statistic is what statistic is to be displayed in the report. Servers selects which WebSphere instance(s) (if multiple) will be included in the report.
The statistics to choose from are as follows:
- Peak Logins
- Total 2-Way Chats
- Total n-Way Chats
Once the filters are applied, the line chart can be drilled down even further by clicking on the individual instances in the legend at the bottom. This will hide/show those instances from the line chart.
All Reports can be printed with the "Print Report" button located at the top of every report page.