The Dashboard Bar includes 3 sub-pages that give the user Vital insight into the health of the configured servers and databases.
About the Dashboard Bar
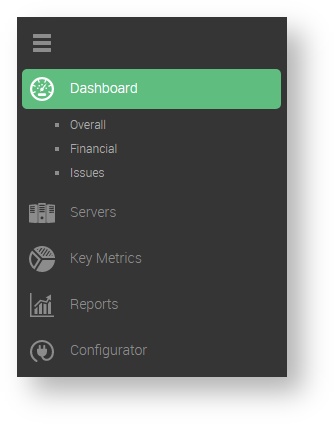
The Dashboard Bar is the 1st in 5 separate categories in the Side Bar Navigation Pane. The pages that can be accessed from this category are the following:
Overall: This page shows the status of all configured servers, as well as several availability-related widgets.
Financial: This page shows several informative graphs relating to the costs of all configured servers.
Issues: This page gives a list of all current issues reported by VitalSigns, and gives information on all issues.
| Note |
|---|
When the user clicks on the Dashboard button, VitalSigns will navigate to the Overall page by default. |