Navigate to: Key Metrics » CPU / Memory / Disk Utilization
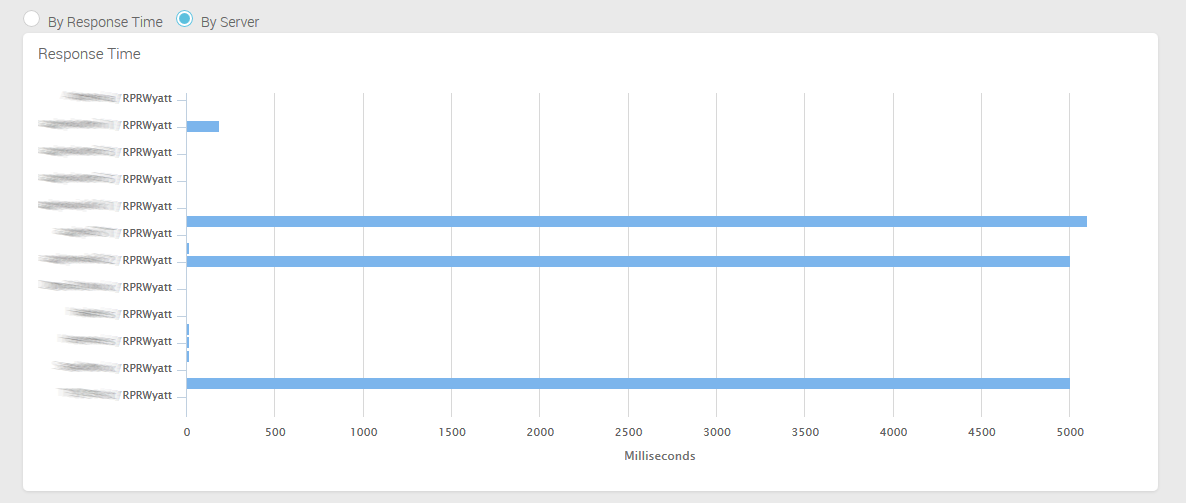
Response Time
The Response Time provides a graph for the average response time for each server. You can view response times sorted by server name (alphabetical) or by longest response time.
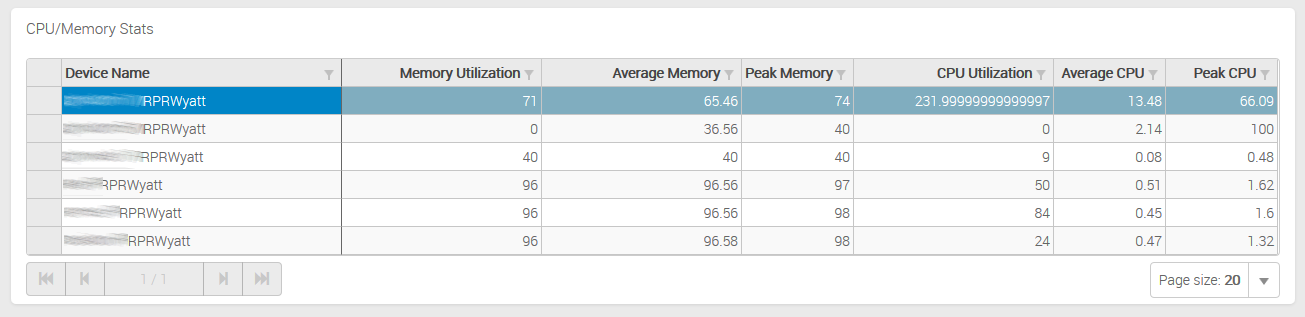
CPU/Memory Stats
The CPU/Memory Stats section provides detailed information for the memory and CPU utilization on a specific server.
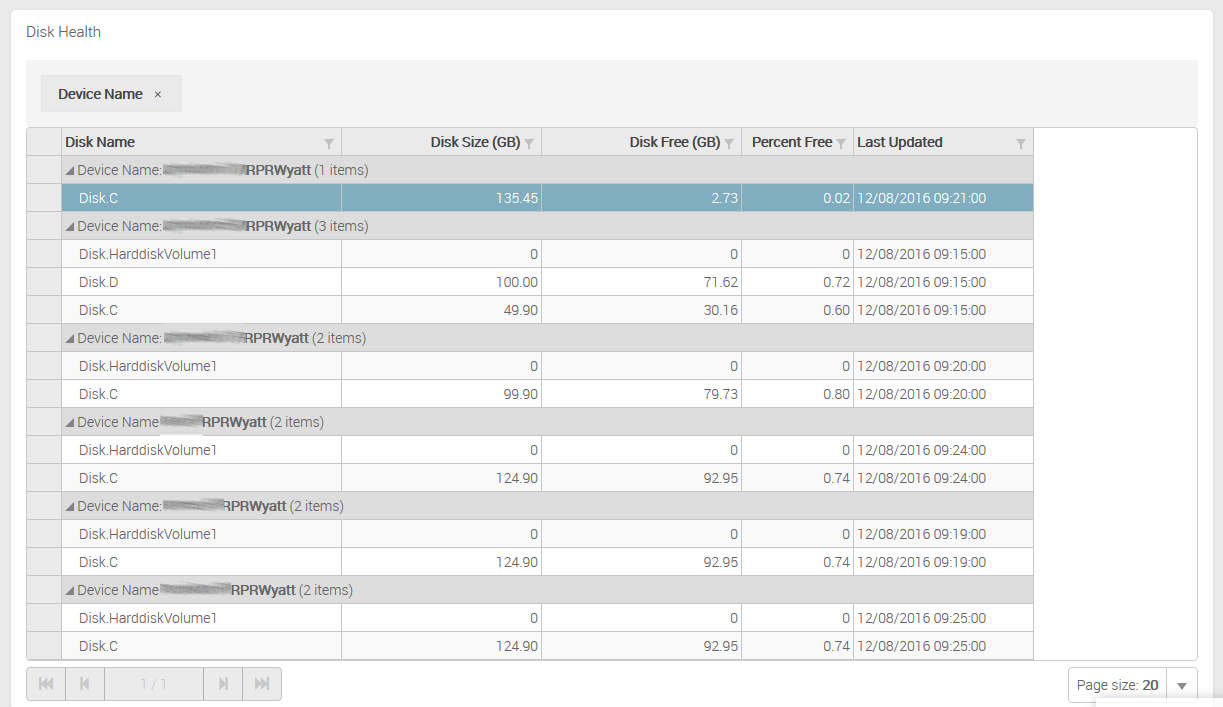
Disk Health
The Disk Health section provides detailed information for each disk on a specific server.
VitalSigns gathers disk information for all servers even if disk checking is not enabled. If you enable disk monitoring for specific or all disks, VitalSigns will alert you if the disk settings have reached the specified thresholds.