The IBM WebSphere Active Thread Count Report features a line-chart that details the change over time
About the IBM WebSphere Active Thread Count Report
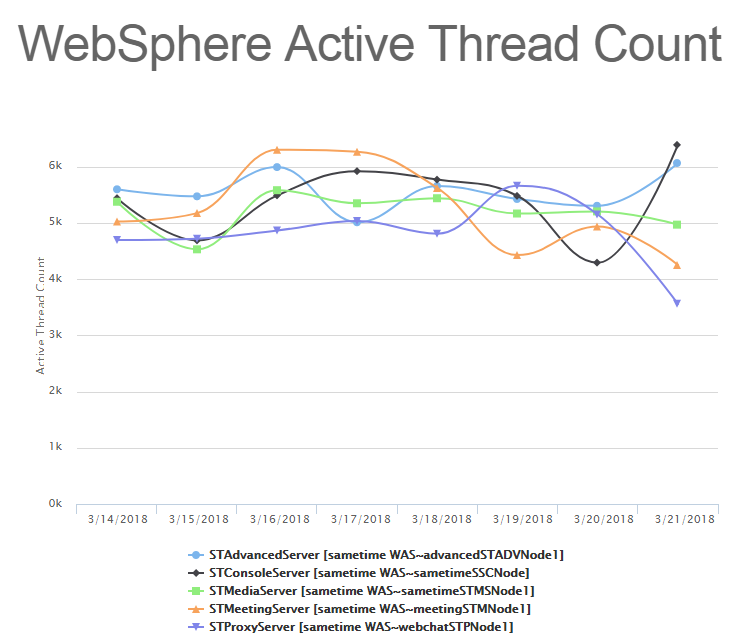
The IBM WebSphere Active Thread Count Report features a line chart that displays the daily average of Threads being used on each WebSphere server.
The report itself can be modified by several different filters:
- Start Date
- End Date
- Servers
Start Date denoted the date that the report will start from. Likewise, End Date denotes the date that the report will end at. Servers selects which servers (if multiple) will be included in the report.
Once the filters are applied, the line chart can be drilled down even further by clicking on the individual Servers in the legend at the bottom. This will hide/show those Servers from the line chart.
All Reports can be printed with the "Print Report" button located at the top of every report page.