Succinct description of page in Heading 3
About [Page Title] in Heading 2
Longer description of page in Paragraph
Describe page attributes:
- Attribute 1
- Attribute 2
- ...
- Attribute n
More description
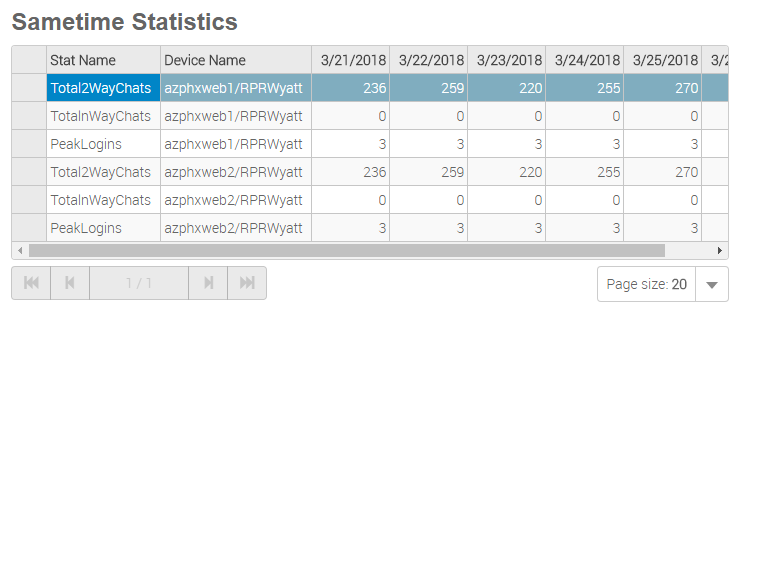
The Sametime Statistics Grid Report describes the information found in the Sametime Statistics Chart Report in a table format.
About the Sametime Statistics Grid Report
The Sametime Statistics Grid Report is host to a complex table that numerically displays all of the information that the Sametime Statistics Chart Report can display.
The report itself can be modified by several different filters:
- Start Date
- End Date
- Servers
Start Date denoted the date that the report will start from. Likewise, End Date denotes the date that the report will end at. Servers selects which WebSphere instance(s) (if multiple) will be included in the report.
The table is set up in such a way that each Device Name will have 3 Rows that have one statistic each. The Columns after the Device Name column are for each day in the Start Date to End Date range.
| Tip |
|---|
All Reports can be printed with the "Print Report" button located at the top of every report page. |