The Mail Stats Tab has multiple Statistics about the status of Mail in the Office 365 environment.
About the Office 365 Mail Stats Metrics tab
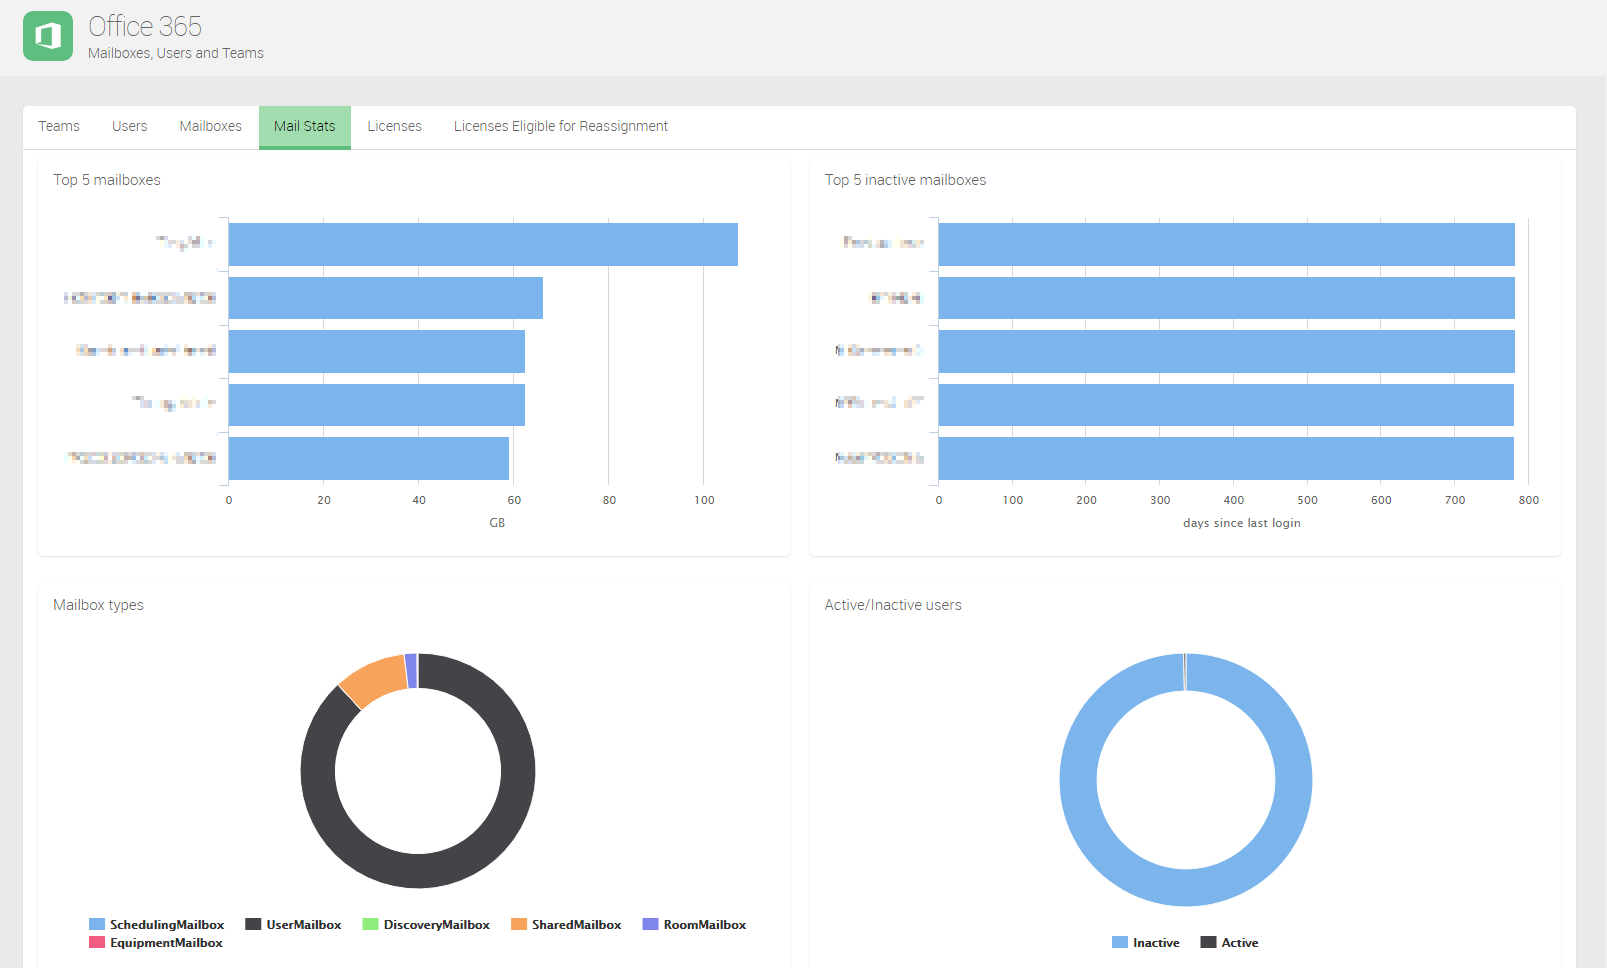
The Mail Stats tab features multiple graphics that detail certain stats about Office 365 in the VitalSigns environment.
The graphics are as follows:
- Top 5 mailboxes
- Top 5 inactive mailboxes
- Mailbox types
- Active/Inactive users
Top 5 Mailboxes is a bar graph of the top 5 largest mailboxes, and their current size.
Top 5 inactive mailboxes is a bar graph of the top 5 longest inactive mailboxes, and the current amount of days that the mailbox has been inactive.
Mailbox types is a pie chart that shows the distribution of what types the mailboxes are in Office 365.
Active/Inactive users is a pie chart that shows the ratio of Active to Inactive users.
All Key Metrics can be exported to Excel with the "Export to Excel" button located at the top of every Key Metric page.