Succinct description of page in Heading 3
About [Page Title] in Heading 2
Longer description of page in Paragraph
Describe page attributes:
- Attribute 1
- Attribute 2
- ...
- Attribute n
More description
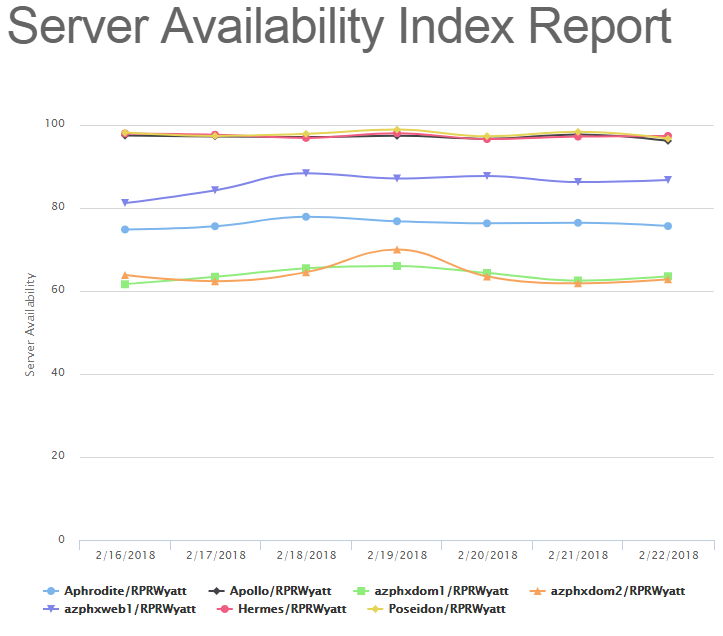
The IBM Domino Server Availability Index Report features a line graph that shows the change over time of the Availability of Domino servers.
About the IBM Domino Server Availability Report
The IBM Domino Server Availability Report contains a multiple-line line graph that shows the daily average Availability for all currently monitored IBM Domino servers within the VitalSigns environment.
The report itself can be modified by several different filters:
- Start Date
- End Date
- Servers
Start Date denoted the date that the report will start from. Likewise, End Date denotes the date that the report will end at. Servers selects which servers (if multiple) will be included in the report.
Once the filters are applied, the line chart can be drilled down even further by clicking on the individual Servers in the legend at the bottom. This will hide/show those Servers from the line chart.
| Tip |
|---|
All Reports can be printed with the "Print Report" button located at the top of every report page. |