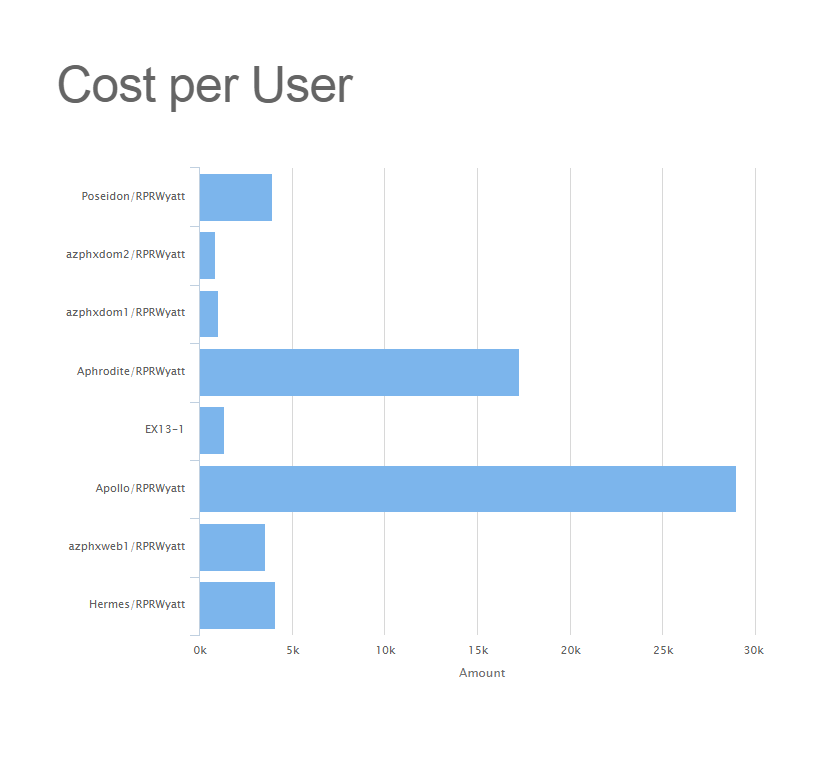
The Cost per User Served Chart Report is a Bar Graph that shows how expensive the server is to operate based on the amount of Users and the Servers Costs.
About the Cost per User Served Chart Report
The Cost per User Served Chart Report is a Bar Graph type report that shows the approximate cost per User Served for every Domino Domino (and Exchange) Server in the EnvironmentVitalSigns environment.
This Report calculates this information based on the amount of users are connected to the Server, and the approximate operation costs of the server based on the number set in the Configurator.
| Tip |
|---|
All Reports can be printed with the "Print Report" button located at the top of every report page. |