The CPU Utilization Report shows a
Line Graphline chart that represent the state of the CPU Utilization of every selected server in the VitalSigns environment.
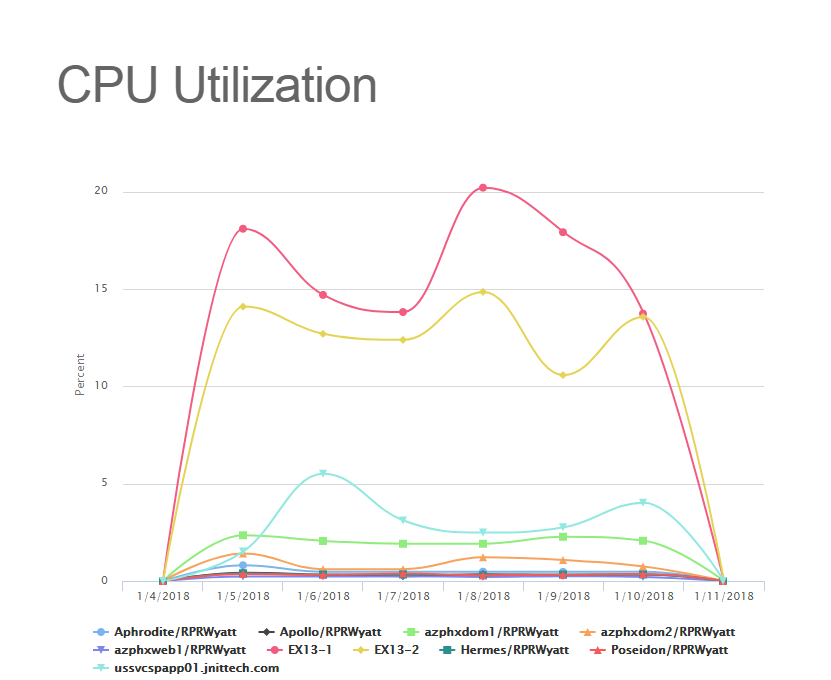
About the CPU Utilization Report
The CPU Utilization Report features a multiple-line Line Chart line chart of the CPU Utilization of every selected server in the VitalSigns environment.
The report itself can be modified by several different filters:
- Start Date
- End Date
- Servers
- Data type (AVG or MAX)
Once the filters are applied, the Line Chart line chart can be drilled down even further by clicking on the individual Servers in the legend at the bottom. This will hide/show those Servers from the Line Chartline chart.
| Tip |
|---|
All Reports can be printed with the "Print Report" button located at the top of every report page. |