The Dashboard is where the information/data about your environment is displayed and can be useful to everybody in the organization. From the HelpDesk team, managers, and to power users they can all be kept up-to-date with the latest status and information in their IT environment from the VitalSigns Dashboard.
About the Overall Page
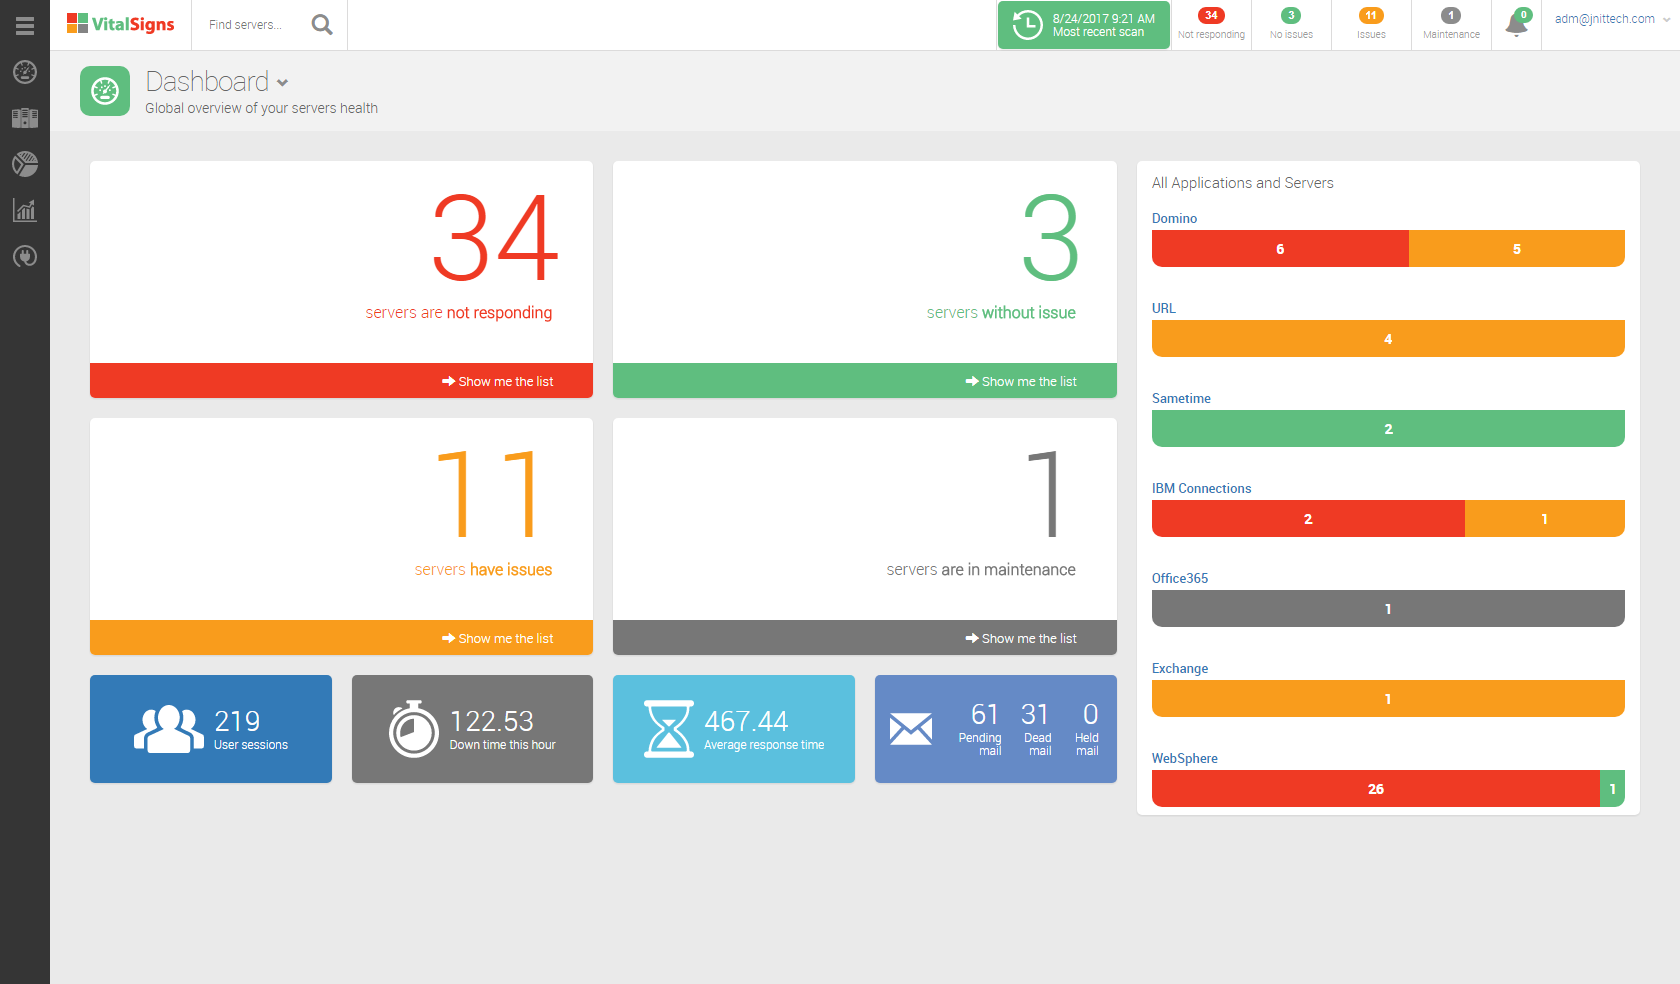
The VitalSigns Overall Dashboard gives a quick overview of the health of your monitored servers.
From this page you will be able to determine:
- The state of your monitored servers.
- A breakdown of states based on server type.
- How many user sessions are active.
- The total server down time of the last hour.
- The average response time of your monitored servers.
- Quick mail monitoring stats.
You will also be able to navigate to:
- Overall <---- [You Are Here]
- Financial
- Issues
- Executive Summary
| Tip |
|---|
| Much of the Dashboard can be clicked for more detailed lists of servers based on type and status. |